


RAND has spent more than a decade surveying educators across the United States and has now expanded this effort to include the perspectives of students and parents. Our seven standing panels of teachers, principals, superintendents, students, parents, adults from the general population, and veterans offer one-of-a-kind insight into the state of American public education.
Among the hundreds of survey questions we fielded this past year, the results depicted in these five charts stood out the most.
They have a common thread: American educators and students are navigating real headwinds. Monitoring our survey data is an important step toward addressing these challenges.
Teachers Are Still Burning Out, and Managing Student Behavior Is a Top Source of Their Stress
Every year since 2021, RAND’s State of the American Teacher project has asked a nationally representative sample of public-school teachers how they are doing. Every year, teachers have reported worse well-being than similar working adults. This past year is no exception: In 2026, U.S. teachers reported poorer well-being on every indicator we track.
The top source of job-related stress is managing student behavior, followed by low pay and working too many hours. Those pressures are not hard to explain: Teachers feel the effects of chronic absenteeism and poor student mental health every day. The toll shows up in how teachers think about their futures. In 2026, only one in four said they planned to stay in the profession as long as they were able. Persistently poor teacher well-being matters not only for educators themselves but also for the students who depend on having a stable, experienced teacher.
Figure 1. Well-Being of Teachers and Similar Working Adults
Frequent Job-Related Stress
| Year | Teachers | Similar working adults |
|---|---|---|
| 2021 | 78 | |
| 2022 | 73 | 41 |
| 2023 | 58 | 40 |
| 2024 | 59 | 33 |
| 2025 | 62 | 33 |
| 2026 | 55 | 34 |
Difficulty Coping with Job-Related Stress
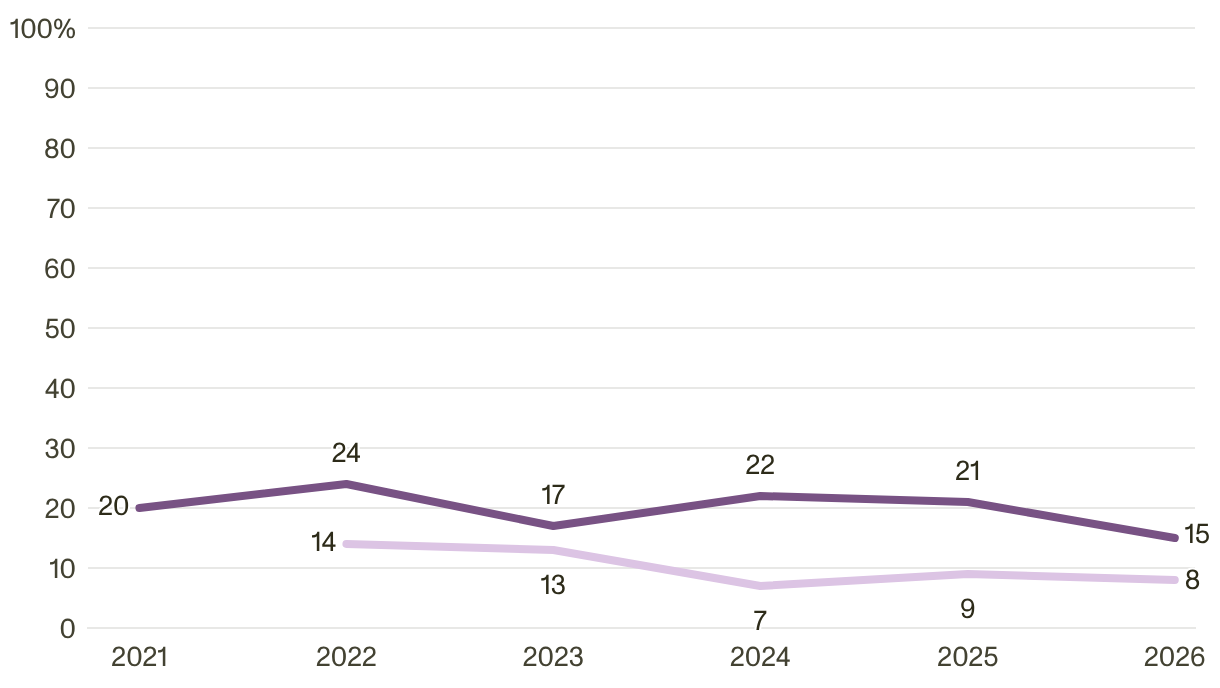
| Year | Teachers | Similar working adults |
|---|---|---|
| 2021 | 20 | |
| 2022 | 24 | 14 |
| 2023 | 17 | 13 |
| 2024 | 22 | 7 |
| 2025 | 21 | 9 |
| 2026 | 15 | 8 |
Symptoms of Depression
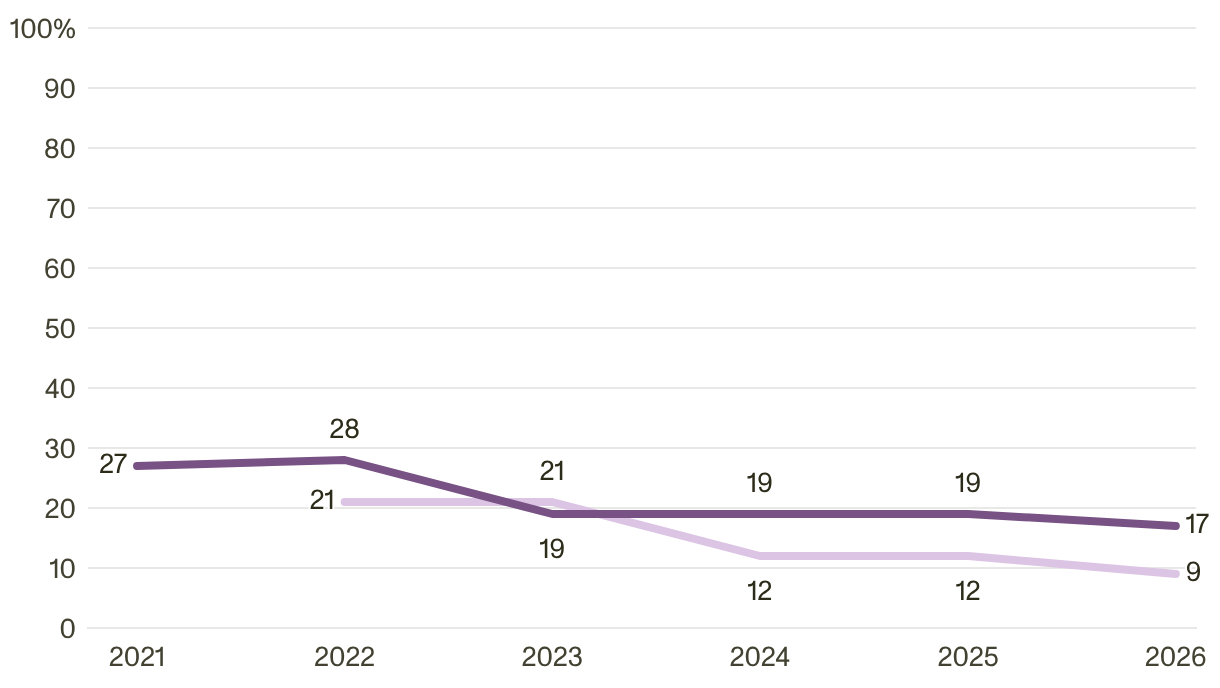
| Year | Teachers | Similar working adults |
|---|---|---|
| 2021 | 27 | |
| 2022 | 28 | 21 |
| 2023 | 19 | 21 |
| 2024 | 19 | 12 |
| 2025 | 19 | 12 |
| 2026 | 17 | 9 |
Burnout
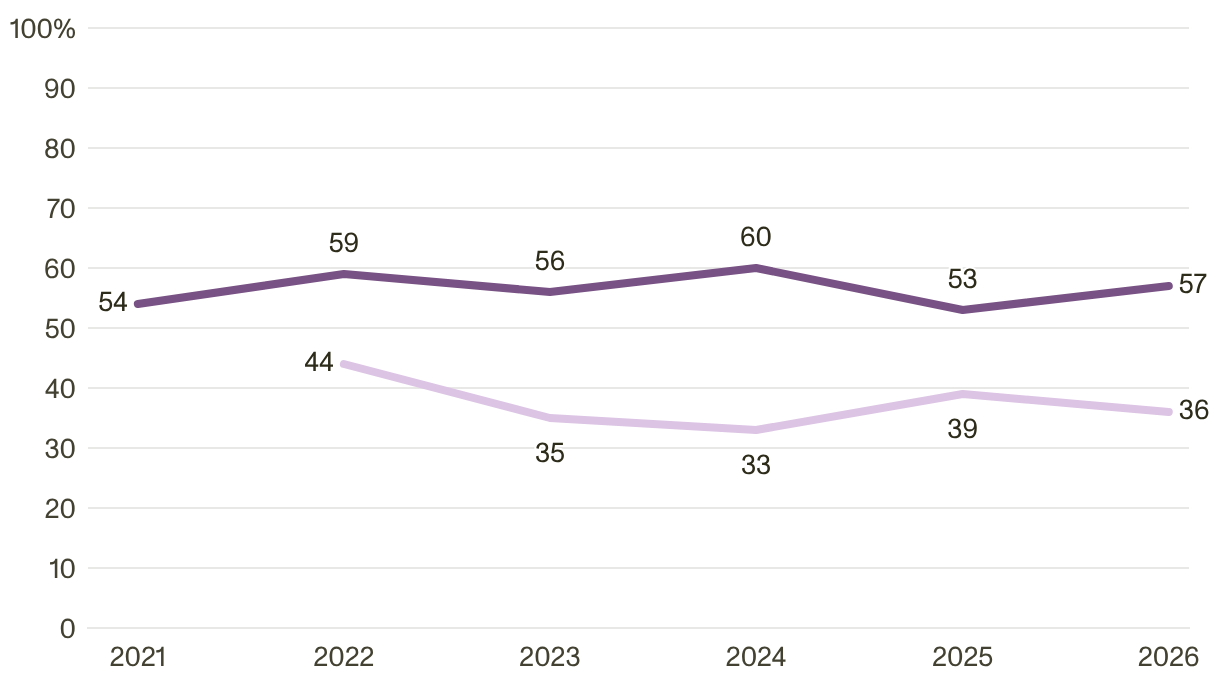
| Year | Teachers | Similar working adults |
|---|---|---|
| 2021 | 54 | |
| 2022 | 59 | 44 |
| 2023 | 56 | 35 |
| 2024 | 60 | 33 |
| 2025 | 53 | 39 |
| 2026 | 57 | 36 |
NOTE: This figure shows the weighted percentages of teachers (purple) and similar working adults (pink) coded as having or experiencing each of the indicators of well-being based on their survey responses. We describe how we measured each well-being indicator in the “How We Conducted This Analysis” section at the end of this report. The sample sizes for the 2026 data are as follows: teachers n = 826–829; and similar working adults n = 498. The 2021–2025 sample sizes ranged from 1,066 to 2,349 for teachers and from 216 to 507 for similar working adults.
SOURCE: Teacher Well-Being, Pay, and Intentions to Leave in 2026
Two-Thirds of Students Agree That Using AI More for Schoolwork Harms Their Critical Thinking
Despite misgivings about AI harming critical thinking, students are using AI tools for homework at growing rates. Repeated nationally representative surveys of youth show that the share of students who are using AI for help with their homework has increased over the last 18 months. That alone might be unsurprising; AI tools are everywhere.
What’s more striking is what students said about the use of such tools: Sixty-seven percent of youth surveyed in December 2025 agreed or strongly agreed that the more students use AI for their schoolwork, the more it will harm their critical thinking skills.
Skepticism about AI is high across grade levels, although older students were most likely to strongly agree about potential negative effects on critical thinking. The sharpest skeptics, however, are students who are not currently using AI for help with their homework.
Figure 2. Percentage of Students Who Agreed or Strongly Agreed That Using AI More for Schoolwork Will Harm Critical Thinking Skills, by Grade
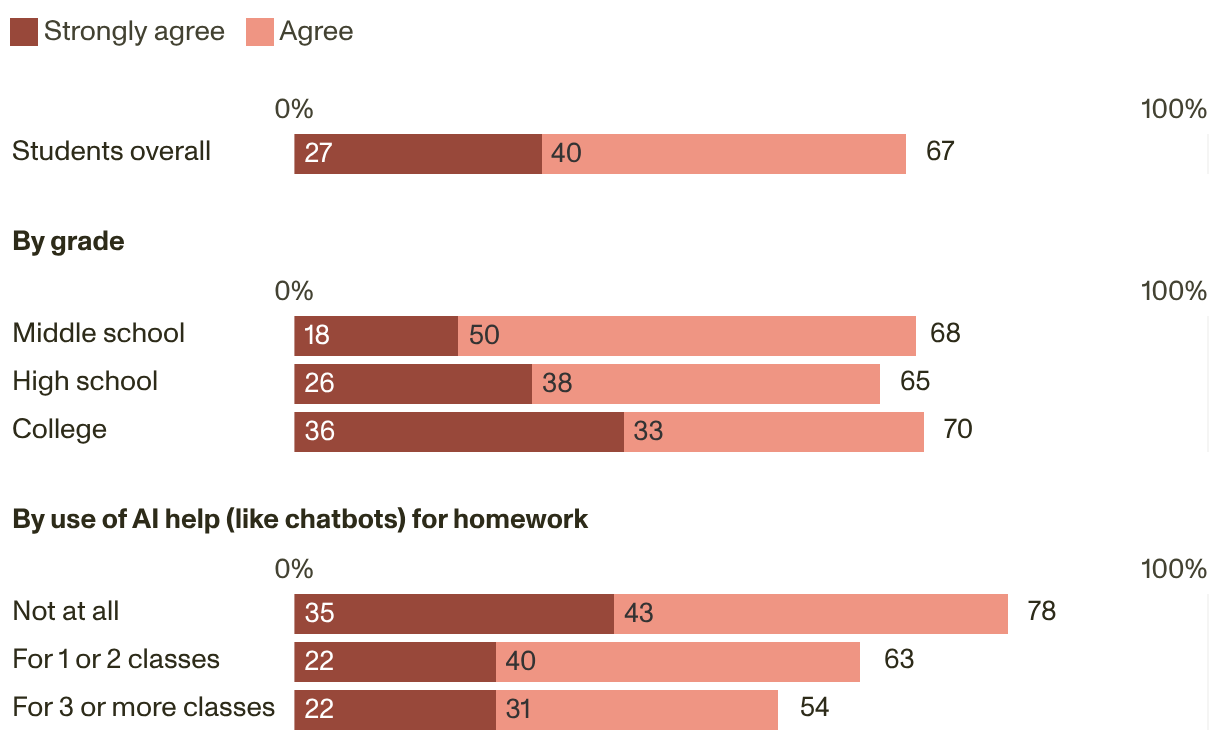
| Description | Strongly agree | Agree |
|---|---|---|
| Students overall | 27 | 40 |
| By grade | ||
| Middle school | 18 | 50 |
| High school | 26 | 38 |
| College | 36 | 33 |
| By use of AI help (like chatbots) for homework | ||
| Not at all | 35 | 43 |
| For 1 or 2 classes | 22 | 40 |
| For 3 or more classes | 22 | 31 |
NOTE: This figure depicts response data from the following survey question administered to a nationally representative sample of youth in December 2025: “How much do you agree or disagree with the following statement? The more students use AI (such as ChatGPT) for their schoolwork, the more it will harm their critical thinking skills” (n = 1,214).
SOURCE: More Students Use AI for Homework, and More Believe It Harms Critical Thinking
Chronic Absenteeism Is Falling—but Remains Well Above Pre-Pandemic Levels
One of the pandemic’s most consequential legacies for American schools is chronic absenteeism—missing 10 percent or more of school days in a year. Rates of absenteeism spiked following the pandemic, with rates initially twice the pre-pandemic norm.
Our latest data reflect some good news: Chronic absenteeism declined over the past year. But there’s bad news, too: In the five years since schools reopened, absenteeism remains well above where it stood before the pandemic, with the highest rates in urban school districts.
It’s not clear that attendance norms will fully reset on their own. That uncertainty matters, because chronic absenteeism rates aren’t just a number. Higher rates predict lower academic achievement and higher dropout risk, meaning every school year in which rates remain elevated represents a real cost to students’ futures.
The decline in absenteeism is reason for cautious optimism, but this issue still demands continued attention from school and district leaders.
Figure 3. Chronic Absenteeism Rates by School Year and Percentage of Students Who Were Absent
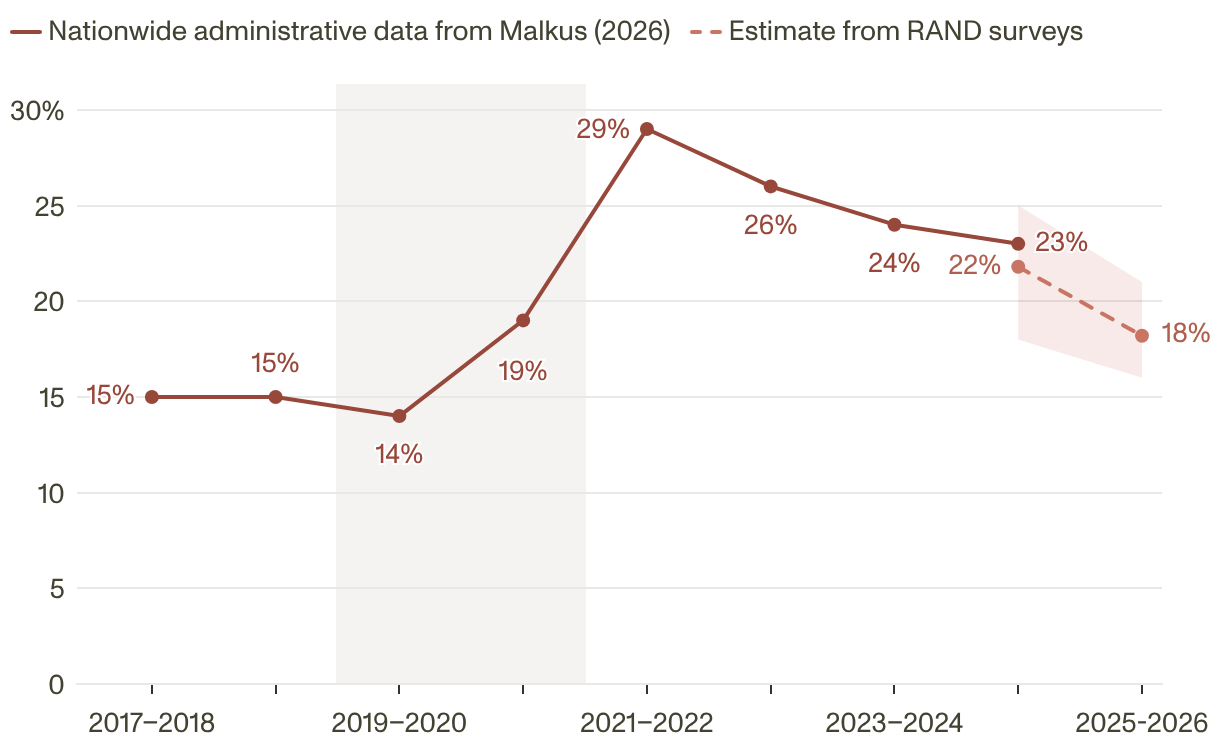
Nationwide administrative data from Malkus (2026)
- 2017–2018: 15%
- 2018–2019: 15%
- 2019–2020: 14%
- 2020–2021: 19%
- 2021–2022: 29%
- 2022–2023: 26%
- 2023–2024: 24%
- 2024–2025: 23%
Estimate from RAND surveys
- 2024–2025: 22%
- 2025–2026: 18%
NOTE: This figure depicts response data from the following survey question administered to a nationally representative sample of district superintendents in spring 2026: “Approximately what percentage of your students have missed 10 percent or more of school days thus far this school year?” (n = 373). The shaded area in our survey-based estimates represents the 95 percent confidence interval associated with each data point. Nationwide data obtained from Nat Malkus, “Progress on Absenteeism is Stalling. What Can We Do About it?” (EdWeek, February 2, 2026). Administrative records on absenteeism were unreliable during the 2019–2020 and 2020–2021 school years.
SOURCE: Data Insights from the RAND Survey Panels: Chronic absenteeism is declining but remains elevated since the COVID-19 pandemic
Students and Smartphones: More-Restrictive Policies Seem to Mitigate—Not Eliminate—the Problem
Policies restricting students’ cell phone use during the school day have spread rapidly across U.S. public schools, driven by increasing concerns about students’ overreliance on their smartphones and evidence linking smartphone use to poor mental health and distracted learning.
But not all phone policies are the same. Local policies vary considerably in how strict they are and when and where phone use is actually prohibited. We identified five distinct types of school cell phone policies across U.S. public schools and examined how each relates to how often students check their phones.
We found that policies that are more restrictive about where and when students can use their phones are associated with reduced percentages of students checking their devices. This result offers a clear signal to school and district leaders that the effectiveness of cell phone policies likely depends on the degree of restrictiveness.
Figure 4: Percentage of Students Who Checked Their Cell Phones During Their Classes at Least Once per Day, by School Cell Phone Policy
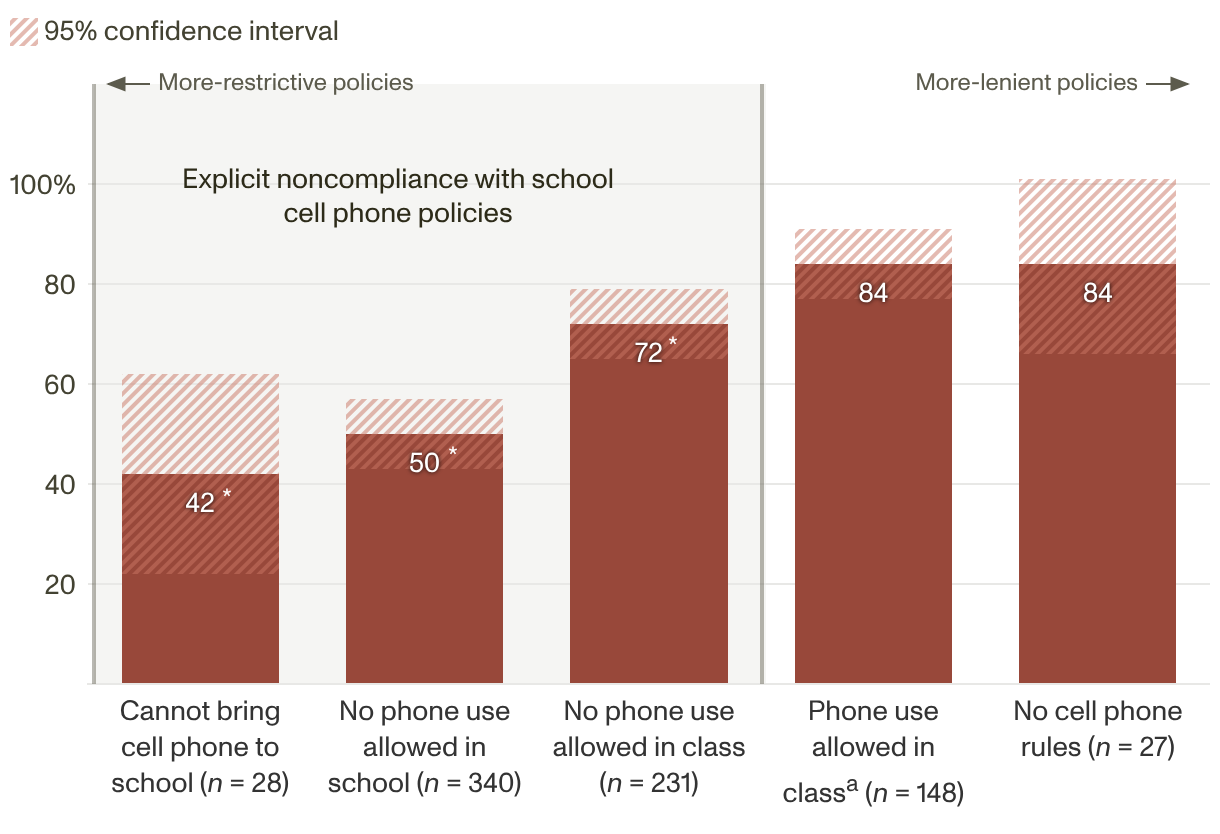
| Category | Total | Lower Bound | Upper Bound |
|---|---|---|---|
| Cannot bring cell phone to school (n = 28) | 42* | 22 | 62 |
| No phone use allowedin school (n = 340) | 50* | 43 | 57 |
| No phone useallowed in class (n = 231) | 72* | 65 | 79 |
| Phone use allowed in class[a] (n = 148) | 84 | 77 | 91 |
| No cell phone rules (n = 27) | 84 | 66 | 101 |
NOTE: This figure depicts response data from the following question: “How often do you check your cell phone during your classes? (Don’t worry, we won’t tell your teachers.)” (n = 774). Nine percent of students indicated that the question was not applicable to them because they do not have a cell phone or do not bring it to school; we count these students as not using their cell phones at school. An asterisk (*) indicates that the percentage of students in a particular school cell phone policy environment who indicated that they checked their cell phone at least once per day was statistically significantly different from the percentage of students in schools where students are allowed to use phones (at teachers’ discretion) who indicated similarly; results remain statistically significant after controlling for other student- and school-level factors, including student gender, race/ethnicity, parent-reported family income, grade level, and school type (i.e., traditional public, private, charter); and results remain statistically significant after also controlling for state.
a Phone use is allowed in class only at teachers’ discretion.
SOURCE: How School Cell Phone Policy Strictness Shapes Student Phone Use
Pre-K Teachers Lack Adequate Materials to Support Children’s Diverse Learning Needs
The materials a pre-K teacher uses shape what children learn and how. Yet a nationally representative survey found that pre-K teachers in public schools are often mixing and matching different instructional materials, likely because no single material adequately addresses the wide variety of needs in their classrooms. Eighty-five percent of pre-K teachers reported using multiple instructional materials, often combining comprehensive curriculum materials with many other resources.
That mixing and matching reflects a gap: Only about half of pre-K teachers said their materials were adequate for supporting children with diverse learning needs, such as children with disabilities or English learners. That gap is illustrated by the higher proportions of teachers trying to serve those diverse needs by using materials of unknown quality, such as materials they create themselves and those available through the website Teachers Pay Teachers.
The earliest years of education, when foundational skills in language, literacy, and numeracy take root, is precisely the wrong time to leave teachers without the tools they need to support every child.
Figure 5: Percentage of Teachers Who Reported Using Each Type of Material for Groups of Students
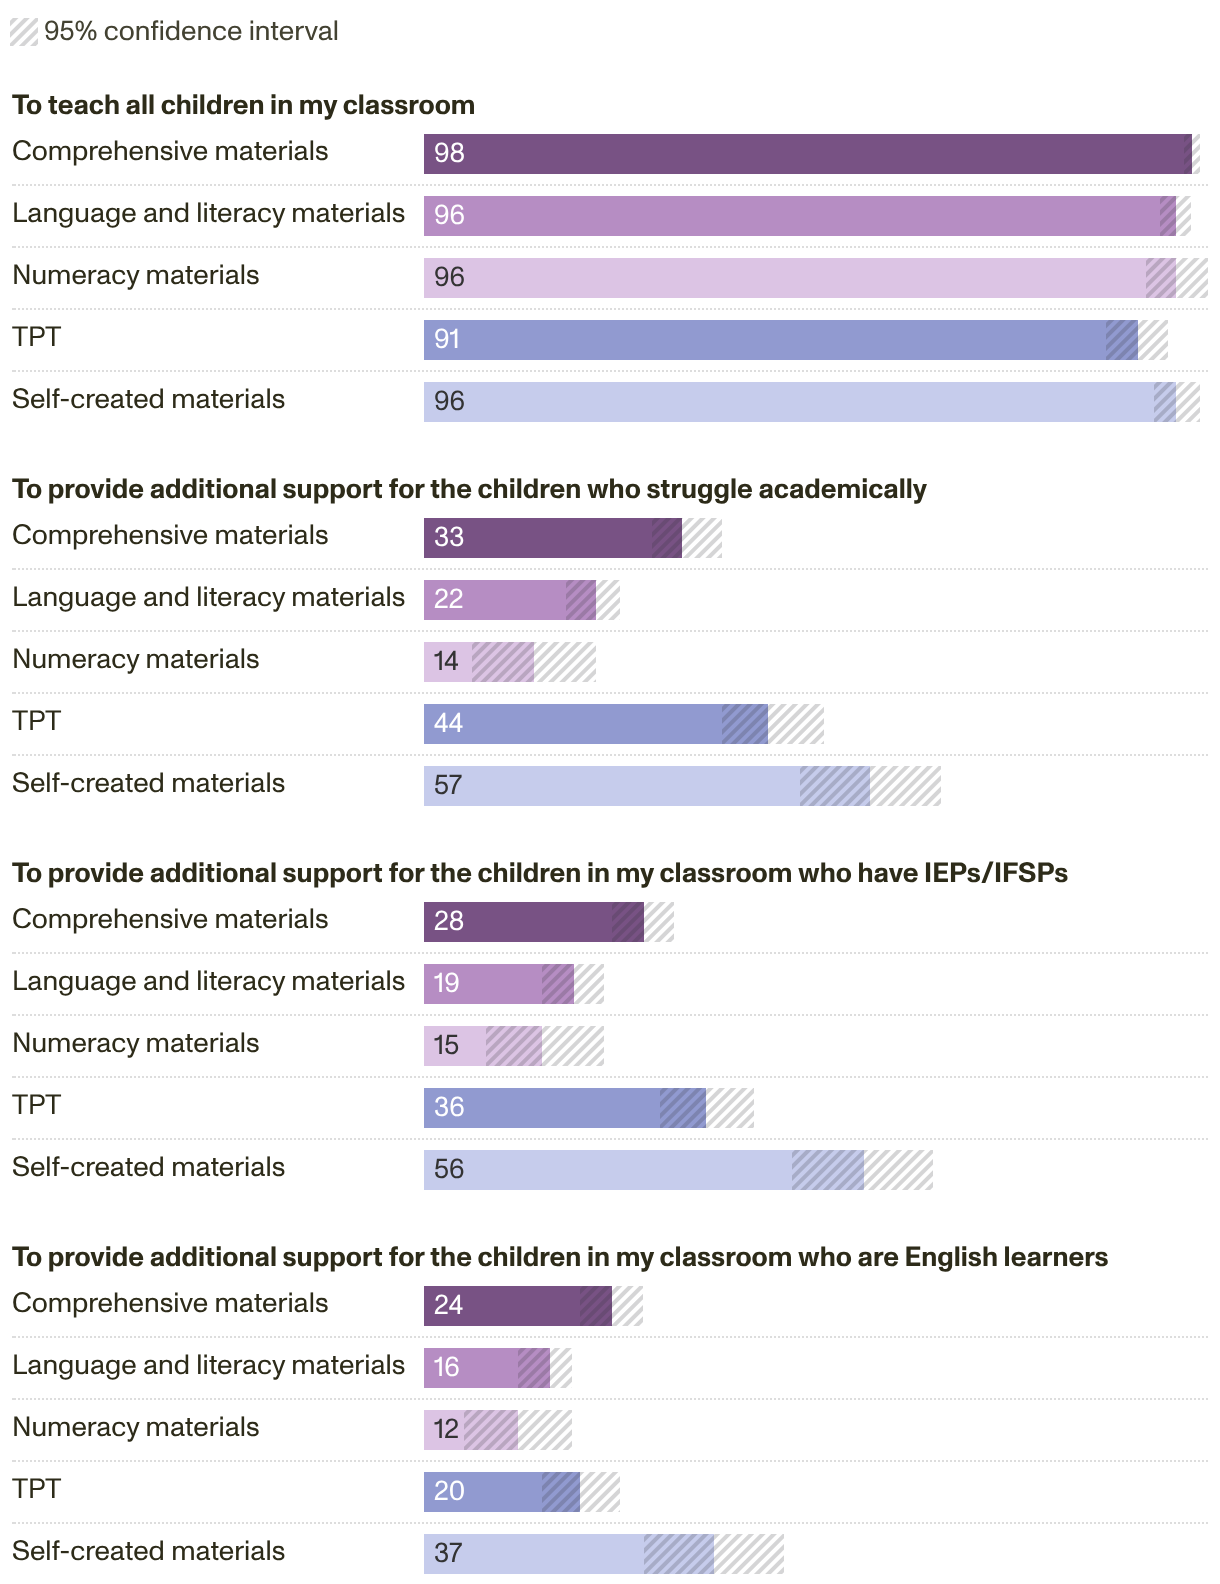
| Measure | Comprehensive materials | Language and literacy materials | Numeracy materials | TPT | Self-created materials |
|---|---|---|---|---|---|
| To teach all children in my classroom | 98% | 96% | 96% | 91% | 96% |
| Lower bound | 97% | 94% | 92% | 87% | 93% |
| Upper bound | 99% | 98% | 100% | 95% | 99% |
| To provide additional support for the children who struggle academically | 33% | 22% | 14% | 44% | 57% |
| Lower bound | 29% | 18% | 6% | 38% | 48% |
| Upper bound | 38% | 25% | 22% | 51% | 66% |
| To provide additional support for the children in my classroom who have IEPs/IFSPs | 28% | 19% | 15% | 36% | 56% |
| Lower bound | 24% | 15% | 8% | 30% | 47% |
| Upper bound | 32% | 23% | 23% | 42% | 65% |
| To provide additional support for the children in my classroom who are English learners | 24% | 16% | 12% | 20% | 37% |
| Lower bound | 20% | 12% | 5% | 15% | 28% |
| Upper bound | 28% | 19% | 19% | 25% | 46% |
NOTE: This figure depicts response data from the following survey question from the fall 2024 PKTS: “How do you use each of these instructional materials?” We asked only about materials that teachers used for literacy instruction, numeracy instruction, or both. Among the teachers who reported using each type of material, we present the percentage who reported using that material to (1) teach all children in their classroom, (2) provide additional support for the children in their classroom who struggle academically, (3) provide additional support for the children in their classroom who have IEPs or IFSPs, or (4) provide additional support for the children in their classroom who are English learners. Diagonal stripes represent 95-percent confidence intervals. For teachers using comprehensive materials, N = 590; for teachers using domain-specific literacy materials, N = 544; for teachers using domain-specific numeracy materials, N = 110; for teachers using TPT (Teachers Pay Teachers), N = 296; and for teachers using self-created materials, N = 144. We do not report results for teachers using district-created materials because of small sample sizes.
SOURCE: How Public School–Based Pre-K Teachers Use and Combine Instructional Materials
As schools open their doors this fall, it’s clear that students, teachers, and principals are navigating many challenges. Tracking those challenges with rigorous data—fielded consistently and shared publicly—is how we at RAND give educators, policymakers, and families the information they need to meet this moment.
Tracking American public education like this requires consistent, long-term investment in asking the right questions. RAND builds and maintains the infrastructure to do that: nationally representative panels that produce timely, comparable data year after year. No single set of surveys can capture everything, but our work can provide some answers to the questions that matter most. We intend to keep asking.
